
The Salary & Satisfaction Survey Results Are In!
Thank you to everyone who participated in our first Salary & Satisfaction Survey. We had a strong level of response, particularly from CEOs, Executive Directors, and Heads of Independent Schools. Here’s what we learned.
Who responded?
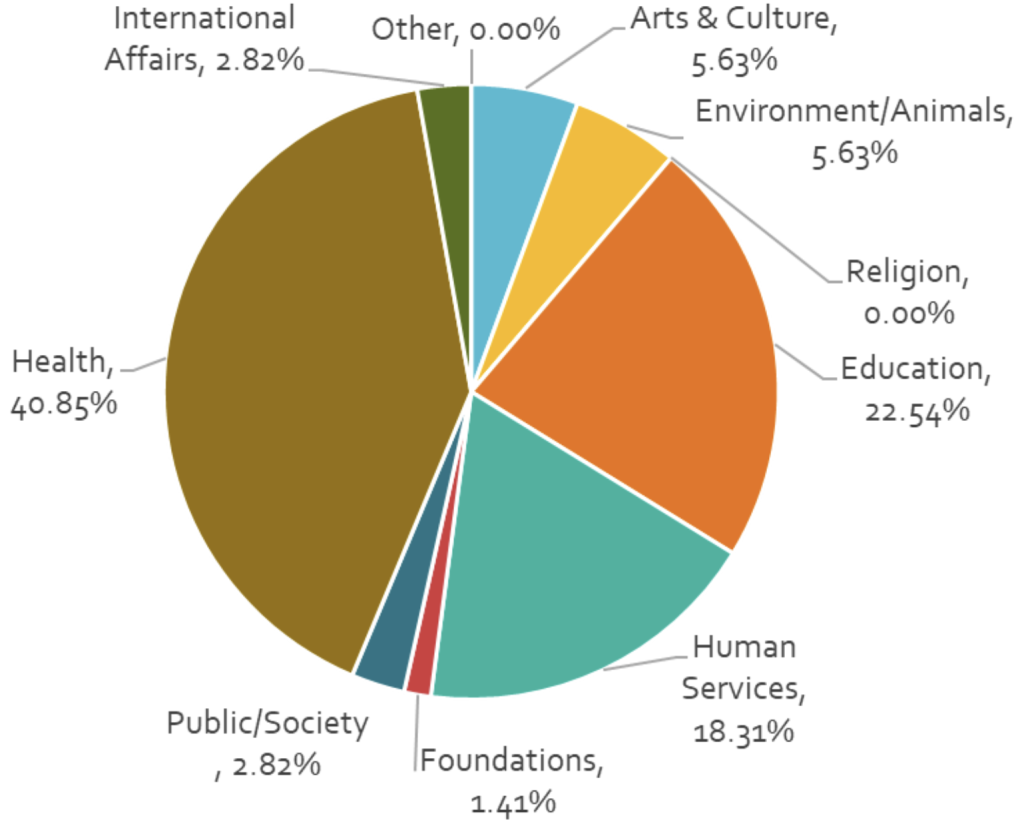
We had responses from 71 organizations, nationwide, from all nonprofit sectors except Religion. (We’re not sure why no religious organizations responded.) The organizations responding represented all size of nonprofits, with 56% of the responses coming from organizations $5 Million or below. CEOs, Executive Directors and Heads of School represented 44% of the respondents.
Of the non-chief executive respondents, 88% came from the fundraising field, which is perhaps not surprising given our client base. We believe the data is statistically significant for chief executives and fundraisers, and only provides directional insights for other nonprofit professionals. (e.g., finance, marketing, programs.) Fundraiser responses skewed heavily C-Level/Chief Development Officers (28%) and non-executive functional leaders such as Directors and Vice Presidents (44%).
What did we learn about salaries?
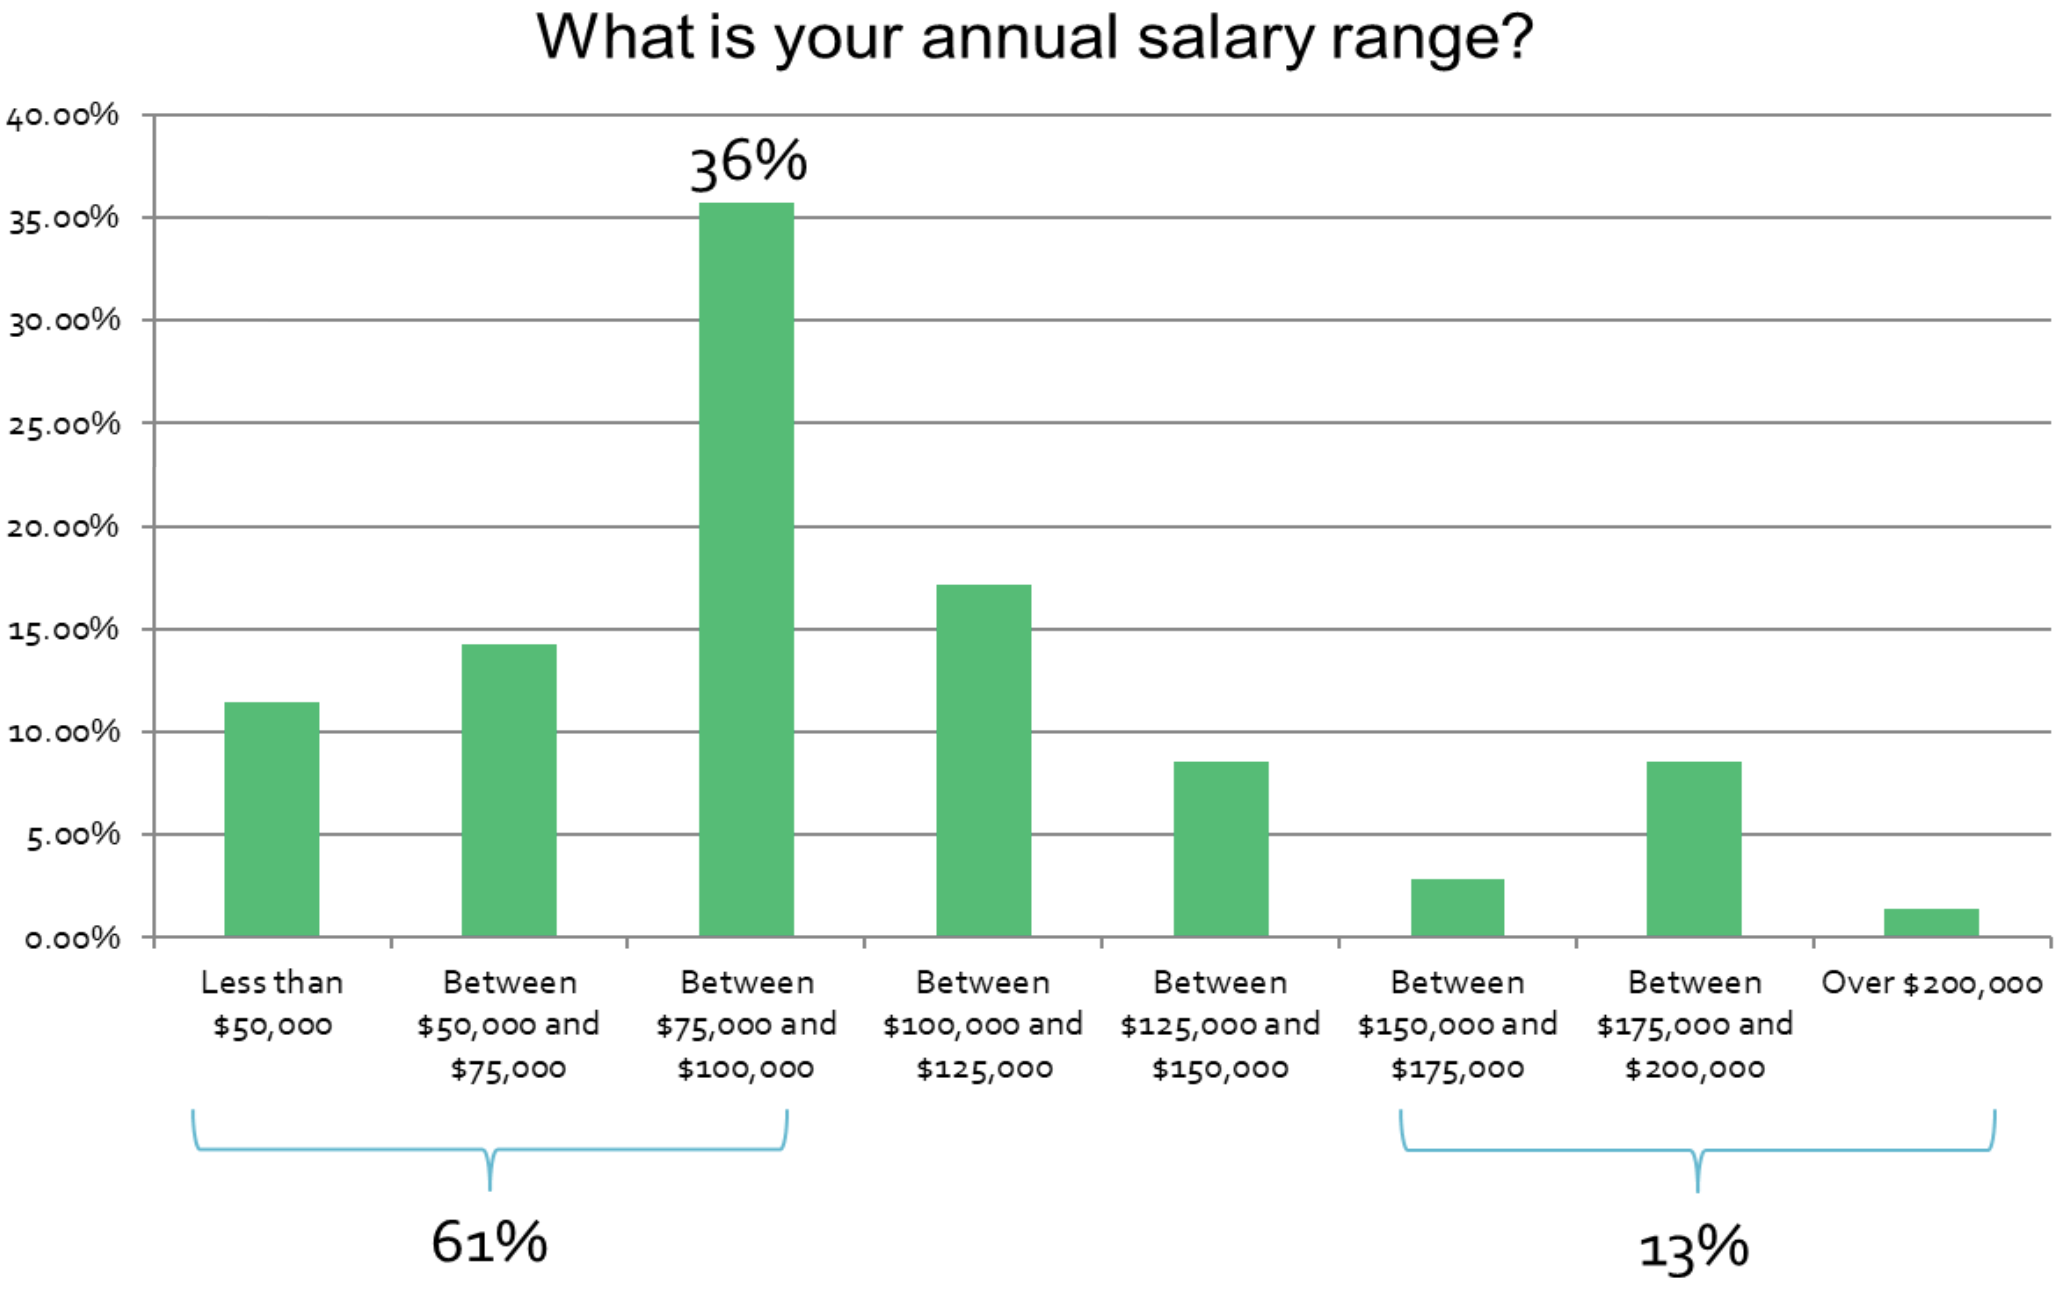
- The average salary of the nonprofit professionals responding is $112,143.
- 61% of those surveyed make less than $100,000, with the majority (36%) in the $75,000 – $100,000 range.
- 13% of the respondents earn over $150,000.
What did we learn about job satisfaction?
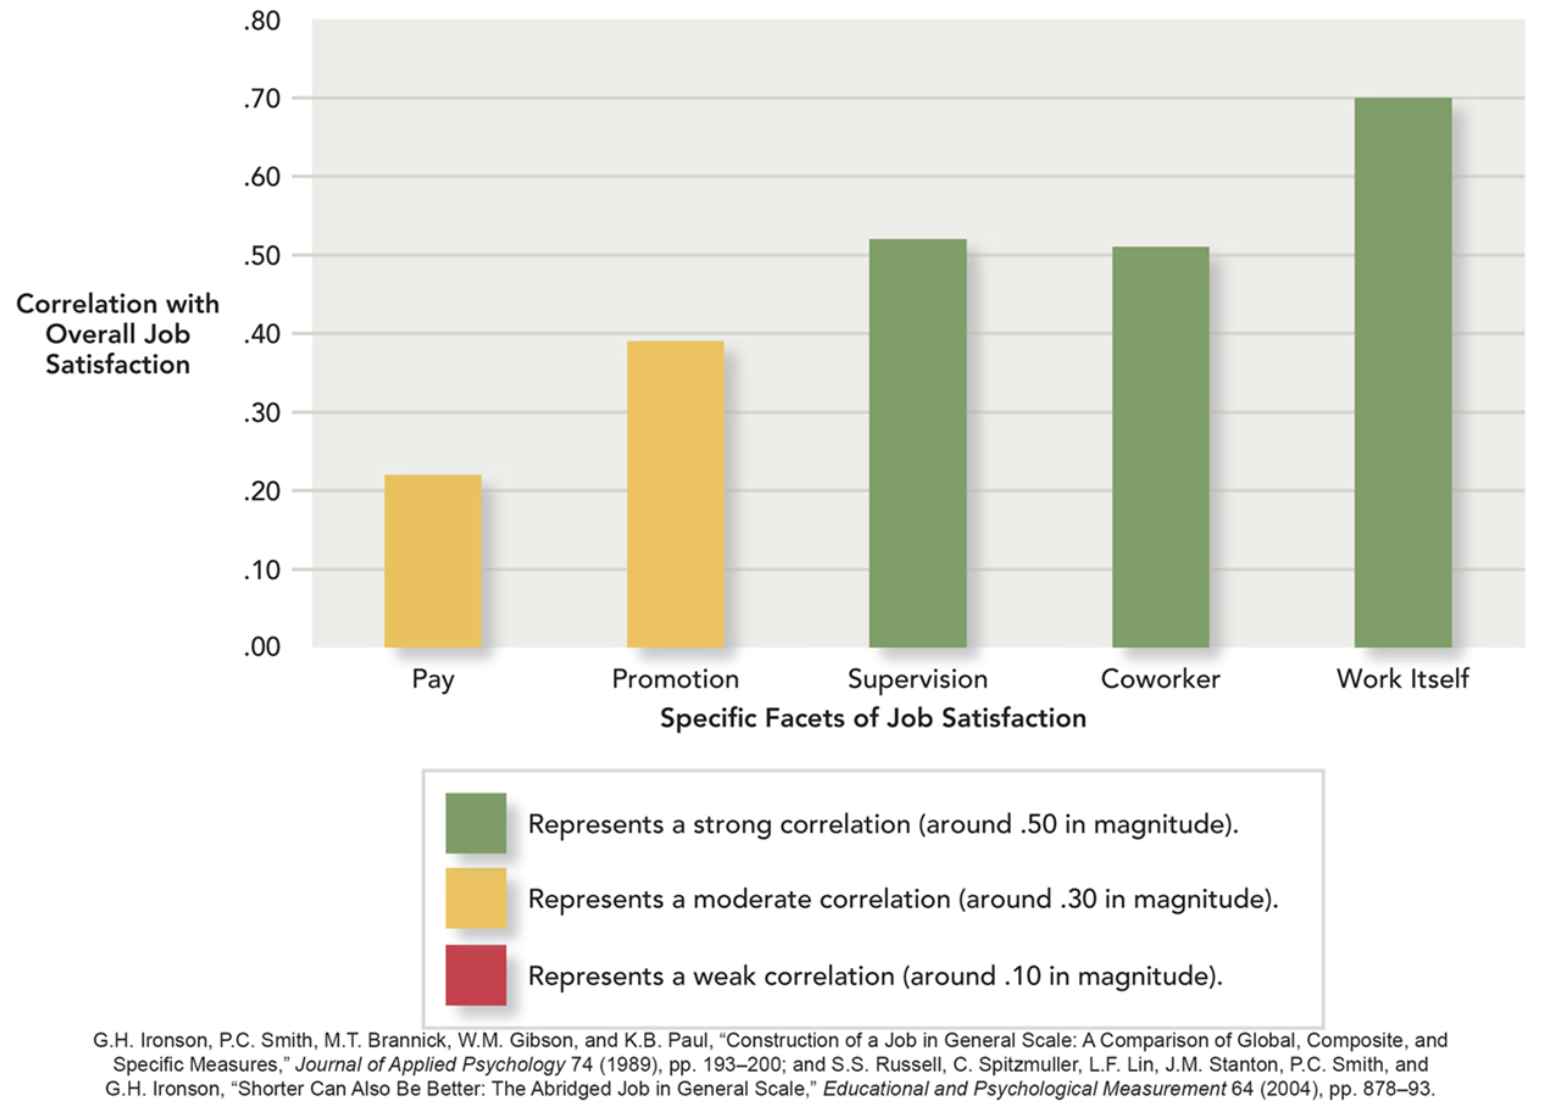
Before we talk about the satisfaction results, we need to talk a bit about the drivers of job satisfaction. Research published in the Journal of Applied Psychology in 1989 by GH Johnson and colleagues, still found to be relevant today, state there are 5 sources of job satisfaction that broadly and statistically correlate to it. Salary has the lowest correlation to job satisfaction, while satisfaction with the work itself has the highest correlation.
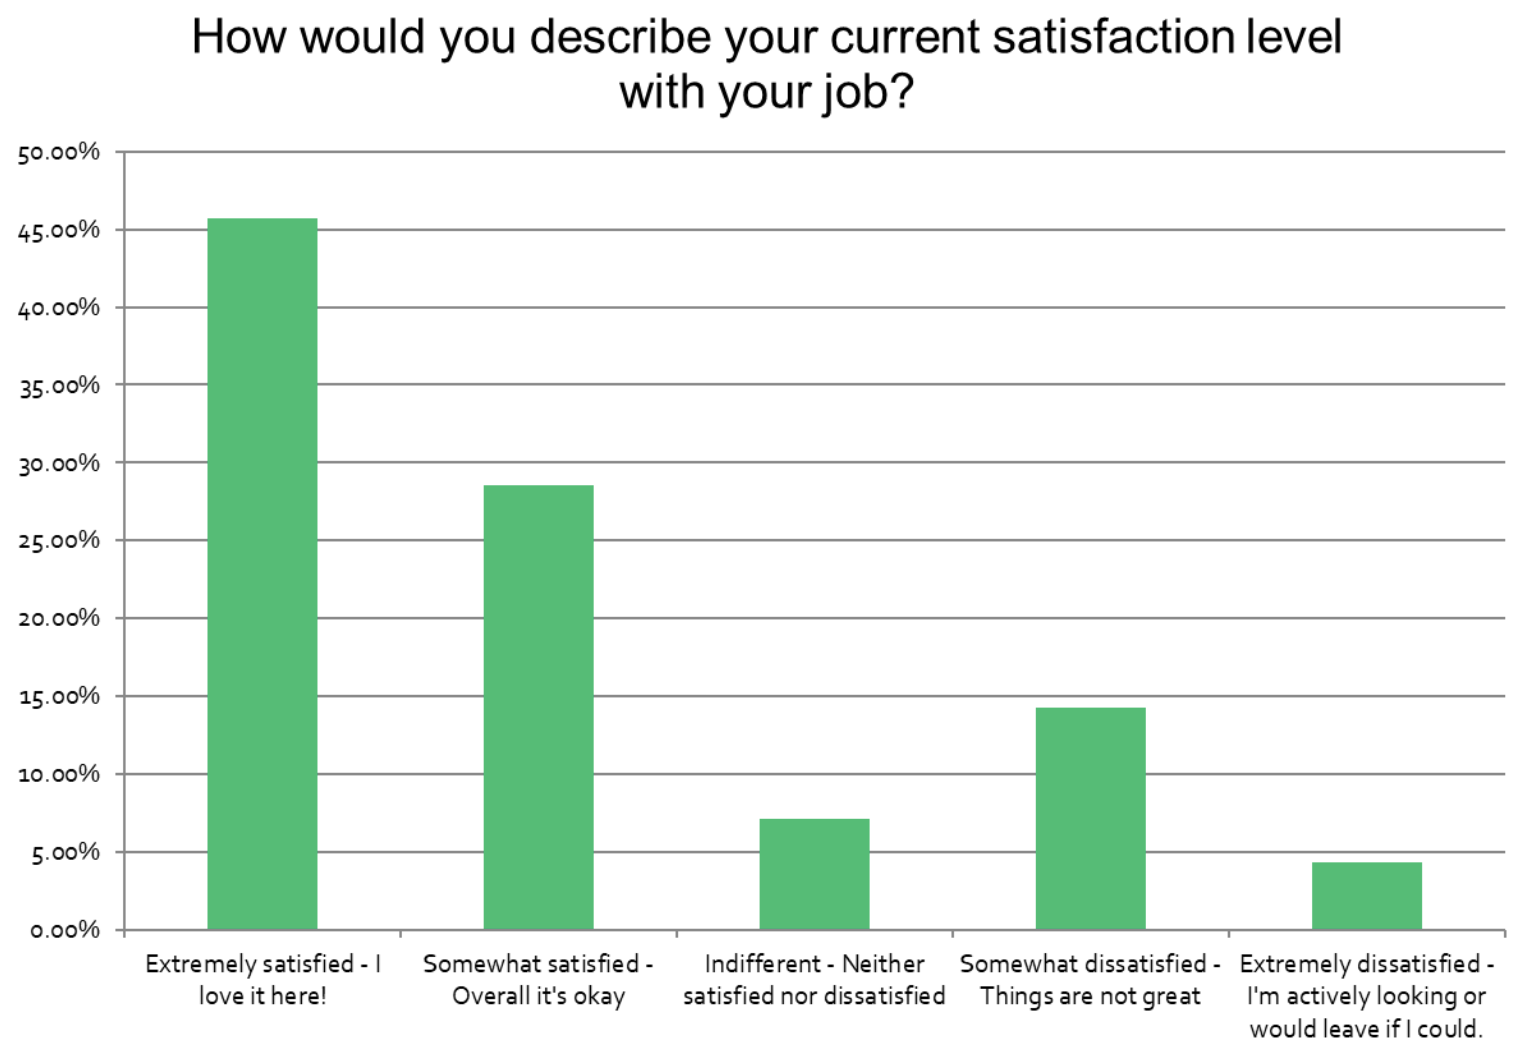
In our survey, we asked respondents to rate their satisfaction with their jobs. Amazingly, Seventy-five percent of respondents say they are Extremely Satisfied (46%) or Somewhat Satisfied (29%) with their job. For comparison, annual research conducted by the Pew Research Center shows that, for most of the last decade, only about half of American workers say they are extremely or somewhat satisfied with their jobs.
We also asked about the respondents’ commitment to their jobs and their motivations to look for new jobs. We were also surprised by these results.
Commitment to an organization can come in different forms:
- Affective Commitment is a deep, emotional bond to the organization, work and mission. You stay with the organization because you want to stay.
- Continuance Commitment is a commitment based on the benefits of staying and/or the cost of leaving. You stay because you need to stay.
- Normative Commitment is a form of commitment based on a sense of obligation or guilt. You stay because you believe you ought to stay.
Seventy-three percent (73%) of respondents identify as having an affective commitment to organizations. While we might be tempted to believe that means the nonprofits responding don’t have to worry about turnover – and admittedly, nearly 80% of the respondents said they are not in the job market – we still asked them what might cause them to leave.
When researchers ask a question like this, we know that the automatic response will be “money.” And, as expected, 53% said compensation would be their highest motivator. We learn more from the next four answers.
- 39% would leave to seek better leadership.
- 37% would leave to seek career growth.
- 31% would seek a better culture or working environment.
- 28% would be motivated to leave because of unrealistic goals or performance expectations in their current job.
In fact, you’ll see when we talk about the free-from responses to the survey, many of their comments focused on needing to feel valued and on realistic goals and expectations.
We asked about demographics
We asked really detailed information about demographics. While there was an option not to answer, the majority of respondents did. The terminology and scope was deliberately comprehensive, much more comprehensive than most employment surveys. Here’s what we learned.
- 30% of the respondents identify as male/masculine, and 70% of the respondents identify as female/feminine. No respondents chose another category outside of the binary.
- There was a strong bell-curve of respondents to the survey in terms of age. The median age of the respondents who chose to answer was 53, and the 45-54 age bracket had the largest number of respondents (30%),
- The median nonprofit career length was 15-20 years. 44% of the respondents had a career length greater than 20 years, which is not surprising given the strong representative of senior executives in the respondents.
- Racially, 83% of the respondents were white, closely in line with the Association of Fundraising Professional’s (AFP) racial distribution data. 7% were Black/African American, 3% Latinx/Hispanic, 1% Asian, 1% Native American or Alaska Native, and 1% identifying as 2 or more races.
- 88% of the respondents were not a veteran.
- 91% reported no disability or access challenges. Interestingly, 6% preferred not to answer this question. These two responses may suggest that nonprofits may not be as welcoming to individuals with disabilities as we would like to believe, even if they serve individuals with disabilities.
- 89% of the respondents identify as straight, and 11% identify as gay or queer. This suggests that non-straight individuals are not disproportionately represented in nonprofit, despite anecdotal evidence to the contrary.
- There was a surprising, perhaps disturbing absence of any transgender respondents to the data, suggesting that nonprofits are not insulated from the societal pressures and issues confronting those individuals.
What did we learn from the comments?
When we created a word-cloud from the comments data, two terms were overwhelmingly present: “feeling valued” and “realistic.” Realistic, which was the second most common term, was applied to goals, expectations, and donors.
Let’s talk about feeling valued first. There were two tracks to the comments. First, it is important that boards and leaders make their teams, including the EDs, Heads of Schools and CEOs feel valued. The second track was that they are failing to do so. Boards especially.
Other data we have shows that the average cost of losing an employee can cost thousands of dollars. Some studies predict that every time a business replaces a salaried employee, it costs 6 to 9 months’ salary on average. For an employee making $112,000 a year, that’s $56,000 to $84,000 in recruiting, turnover, training expenses, plus lost productivity.
Realistic expectations are part of feeling valued, and this data shows us that most nonprofit employees are not feeling that the expectations placed on them are realistic. The overwhelming driver of this is unrealistic goals. We published a really popular article about this at the start of the summer. Many nonprofits adopt stretch goals to justify budgeting what they want to spend. Stretch goals seldom work in any company, and almost never in a nonprofit. The reason is that, for a company to adopt stretch goals, they have to have what is known as “slack”. Slack is essentially an abundance of resources. We know of no nonprofit that can say they have that.
Key takeaways
Let’s start with why we did this survey in the first place.
Thought leadership is an important part of what we do. Our clients pay us as much for our expertise as for our time. So, we’ve always tried to leverage our summer months to build that expertise by talking to experts, and there is no better expert on nonprofits than the people who work in them.
This all started with our blog. We like to talk broadly about challenges to and best practices for nonprofits. We don’t like to limit ourselves to just fundraising matters. We always receive good traction with our blog posts, but two of last year’s posts really seemed to strike a chord with our audience.
These were two of the most popular blogs we’ve ever written. Candidly, the response told us that our clients want to know more.
Our purpose in conducting this survey can be summed up in two words: “talent retention.” There is a misnomer among boards and nonprofit leaders that employee retention is the responsibility of the employee themselves. It’s not. Talent retention is the responsibility of leadership. And, as we mentioned above, turnover is expensive.
So, what should nonprofit boards and leaders take away from this survey?
First, nonprofit leaders and employees will typically feel higher levels of satisfaction if they feel valued and that they have realistic goals.
Second, turnover in these positions is expensive, and nonprofit boards should care about minimizing it, especially for Executive Directors, CEOs, Heads of Schools and chief fundraisers.
Third, salary is not the answer. When people quit these roles, it is seldom to chase a higher salary. Instead it is because their organizations are failing to provide the important things that would retain them.
And, lastly, when nonprofit boards or leaders want help with this, they should turn to Our Fundraising Search.
A podcast with the results of this survey explained in detail is available via our blog and The Nonprofit Snapcast.


[…] Director of Our Fundraising Search joins the SnapCast to explore the results of their recent Nonprofit Salary & Satisfaction Survey. The results are in, and we are ready to share. This session was recorded live. Were there […]
[…] Director of Our Fundraising Search joins the SnapCast to explore the results of their recent Nonprofit Salary & Satisfaction Survey. The results are in, and we are ready to share. This session was recorded live. Were there […]