As consultants, we try to be genuine thought partners for our clients. If you’ve been around our blog for any length of time, you’ve undoubtably noticed this. In fact, we built an entire compensation evaluation practice based on the continued popularity of a post we published in April 2021 titled “What is the Right Amount to Pay my Fundraiser?”
In our goal to be a thought partner, we decided to address compensation statistics and drivers for turnover in the nonprofit sector through research. We just completed our second annual Salary & Satisfaction Survey, focused on all nonprofits, nationwide. Here is what we found.
Key Themes
First, we had a larger number of respondents than the previous survey.
The data shows a decline in affective commitment overall, and lower levels of job satisfaction year-over-year. It is unclear if that decline is due to the increased number of respondents or the fact that salaries showed no growth year-over-year.
Not surprisingly, compensation is a growing motivator for career movement, although opportunities for growth and advancement are a strong second.
Dissatisfaction continues to focus on impossible goals and toxic leadership/boards.
Who Responded
We had responses from over 100 organizations nationwide, again from all sectors except religion. While we attempt to survey all nonprofit staffers, most of our responses come from CEOs/Executive Directors/Heads of Schools (47%) and fundraisers.

Organizationally, 58% of the responses came from organizations with budget below $5 Million, which is not surprising given that the vast majority of nonprofits sit in that budget range. 12% of respondents came from organizations above $100 Million.
Of the non-chief executive respondents to the survey, 88% came from the fundraising field, which is perhaps not surprising given OFS’ client base.
Based on the above factors, we believe the data is statistically significant for chief executives and fundraisers, but only provides directional data for other nonprofit professionals. (e.g., finance, marketing, programs.)
Fundraiser responses skewed heavily C-Level/chief development officers (23%, down from 30% last year) and nonexecutive functional leaders such as directors and vice presidents (41%, unchanged). We saw higher representation from non-executive fundraisers this year. (35%)
Surprisingly, nearly one-quarter (24%) of fundraiser respondents specifically identified their role as major gift officers.
What Did We Learn About Salaries?
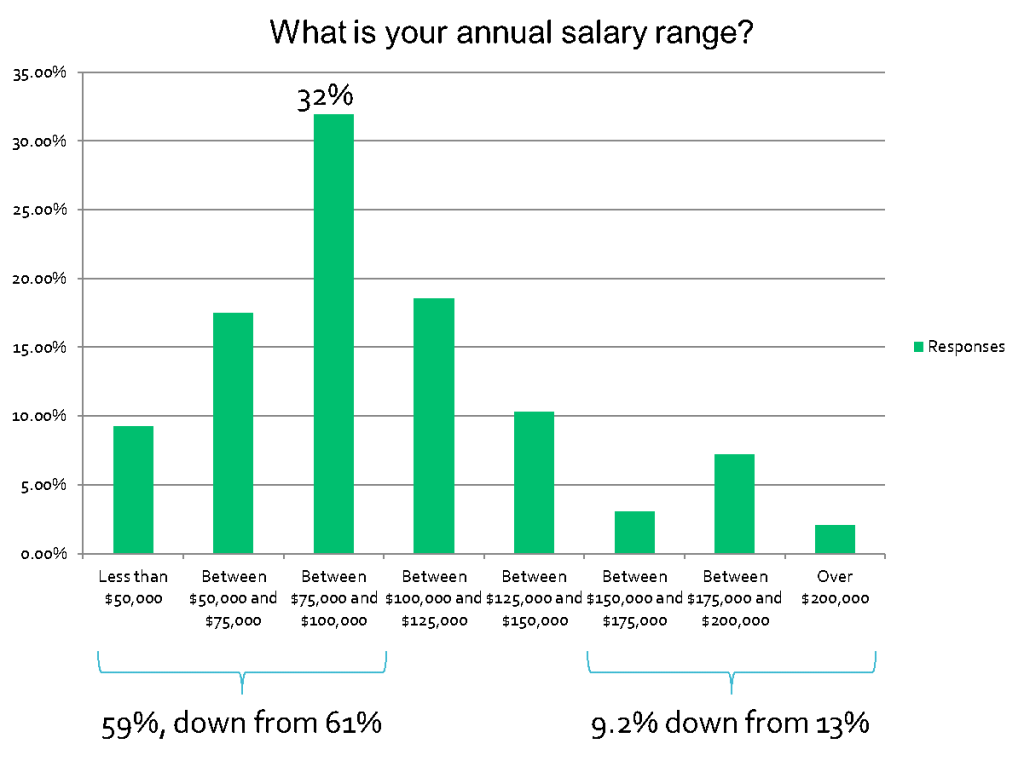
The average salary of the nonprofit professionals responding is $112,895, up from $112,143. (0.7% increase.)

While some of that figure may be skewed by the higher level of non-executive responses YOY, an analysis of top executive salaries showed no movement which we think suggests no movement in salaries lower in the organization as well.
32% of the respondents earn between $75,000 and $100,000, down from 36% in 2023.
What Did We Learn About Satisfaction?
Overall, satisfaction is down. 72% of respondents say they are Extremely Satisfied (38% v 46% in 2023) or Somewhat Satisfied (34% v 29%) with their job, down from 75% a year ago. Again, this could be because the mix of respondents changed YOY, but given the relative lack of salary movement, we are inclined to think not.
Because we have a strong presence in the business of search services, we are always curious about the mindset of employees and their willingness to change jobs. We specifically ask about the types of commitment employees feel towards their organization.
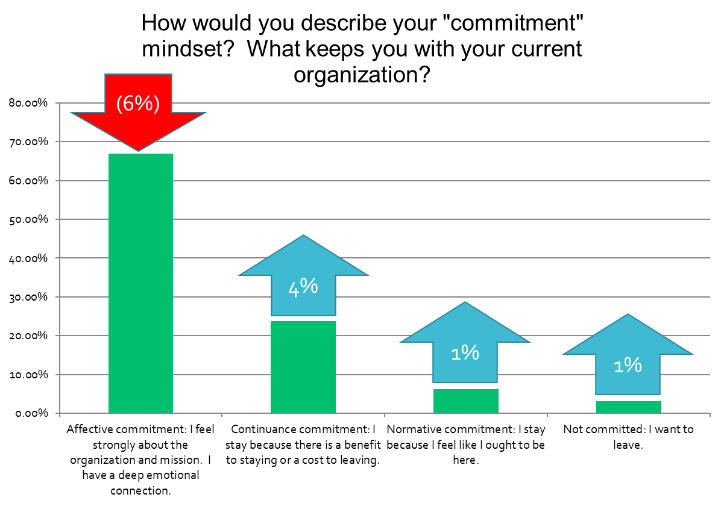
- Affective Commitment: a deep, emotional bond to the organization, work and mission. The employee stays because they want to stay.
- Continuance Commitment: commitment based on the benefits of staying and/or the cost of leaving. The employee stays because they need to stay.
- Normative Commitment: commitment based on a sense of obligation or guilt. The employee stays because they believe they ought to stay.

Obviously, Affective Commitment is what we want from the employees, and yet, YOY we saw it drop by 6%. 67% of respondents describe their commitment to their job as Affective Commitment, down from 73% in 2023. This drop was present at all levels of management.
Interestingly, even though Affective Commitment dropped, 80% say they are not currently in the job market, which is unchanged YOY.
When asked about motivators which would lead an employee to consider leaving, the highest was obviously compensation. The top 5 motivators to leave are:
- Higher compensation
- Opportunities for promotion or career growth
- Seeking better leadership
- Finding a mission that better speaks to me
- Looking for better workplace culture or coworkers
In the comments, we see strong sentiments that suggest the two primary drivers for employee turnover continue to be (1) impossible goals or targets; and (2) toxic work cultures, including toxic boards of directors.
We Also Asked About Demographics
Respondents identified as 70% female, 30% male. None identified outside the binary definitions.
The median age of the respondents who chose to answer was 39, down significantly from 53 in 2023. This may support anecdotal perceptions that a generational cohort change is taking place in the nonprofit sector.
The median nonprofit career length was 15-20 years. However nearly 25% had careers greater than 25-years, while only 7% had careers of less than 5 years, indicating the sector is still lagging in recruiting early career employees.
Racially, 87% of the respondents were white, up 4% YOY.
Fewer respondents were veterans than last year. Most respondents were not disabled or access challenged. This was unchanged YOY, which leads us to believe the sector is not adequately recruiting from some of the demographics which it serves.
11% of respondents do not identify as straight. Straight identifying respondents dropped 2% YOY.
Conclusions
The signs we are seeing of (1) wage compression YOY, especially against higher inflation rates, combined with (2) dropping levels of affective commitment lead us to believe we may see increased turnover in 2025. We think this will be exacerbated by continued departures from the sector at the top of the seniority scale.


Leave A Comment